

Some time ago, our charts developer, Mike Danziger, noticed a strange issue that was showing up for some user-entered lab results. See if you can spot it:
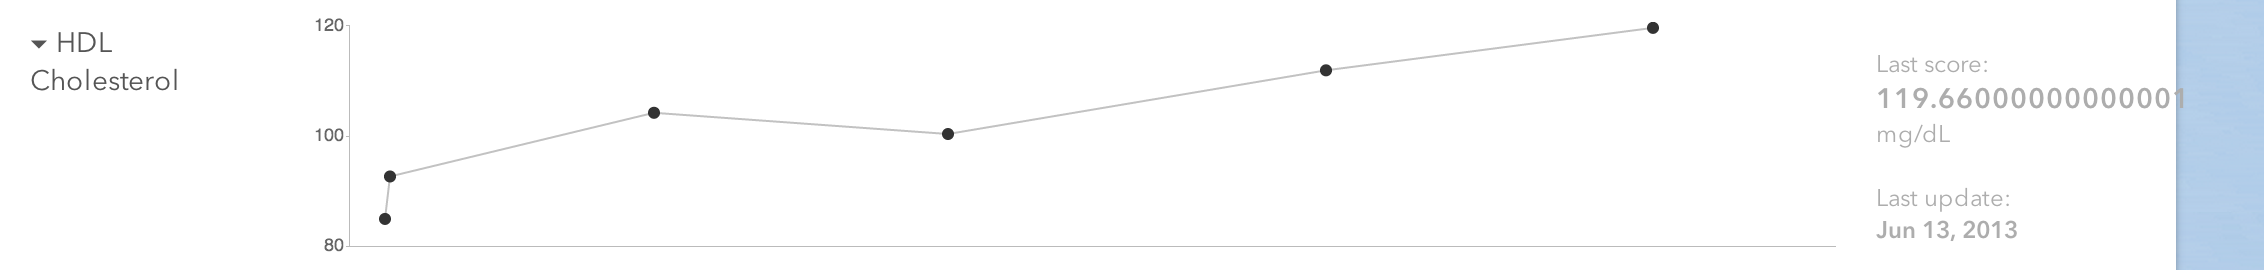
Surely this user didn't actually enter a result of 119.66000000000001 mg/dL for their cholesterol reading. No blood test is that precise, right?
No, of course they didn't. What we're seeing here is a result of floating-point error. Floating-point error happens because in most cases, computers represent fractional numbers in base 2, in which it's often impossible to represent a base-10 fraction in a finite number of digits, so rounding happens. These tiny errors can become larger the more calculations you perform, due to compounding effects.
Floating what?
The official Python tutorial has a great section on floating-point error. The snippet from it that illustrates this the best, I think, is this:
>>> 0.1 + 0.2
0.30000000000000004
We've tried to add two perfectly reasonable base-10 decimal numbers and arrived at a result that isn't possible to represent perfectly in base 2. What we see as a result is an approximation in base 10 of the underlying result in base 2.
Well, our site isn't written in Python - it's written in Ruby, with a great deal of JavaScript as well. Let's see if this also happens in those languages.
nbudin@puck:[~]: irb
irb(main):001:0> 0.1 + 0.2
=> 0.30000000000000004
irb(main):002:0>
nbudin@puck:[~]: node
> 0.1 + 0.2
0.30000000000000004
>
At least it's consistent!
A solution
OK, so what do we actually want to do about this? Fundamentally, we want to take whatever the user actually entered into the site and reflect it back to them as accurately as possible. But there are two complicating factors here:
- Because of floating-point error, it may not be possible to store exactly what the user typed into the site using our existing database schema (which uses floating-point columns for lab results).
- We perform unit conversions on lab values, so floating-point error may compound, growing larger because of the additional arithmetic.
The answer we came up with lies in something I learned about in 11th grade chemistry class: significant figures. Wikipedia defines a significant figure like this:
The significant figures of a number are those digits that carry meaning contributing to its precision. This includes all digits except:
- All leading zeros;
- Trailing zeros when they are merely placeholders to indicate the scale of the number ... ; and
- Spurious digits introduced, for example, by calculations carried out to greater precision than that of the original data, or measurements reported to a greater precision than the equipment supports.
— "Significant figures" on Wikipedia
So if we keep track of how many significant figures the user entered in the first place, and save that along with the lab result, then we can know how many digits we should display back to them. To do that, we'll need some code to determine how many significant figures they entered in the first place. For example, we know that:
- A lab value of 53 has 2 significant figures
- A lab value of 0.01 has 1 significant figure
There are some less clear-cut cases as well, where we have to make some disambiguating assumption:
- A lab value of 0.0120 might have 2 significant figures or 3, depending on if the trailing zero is significant or not. In this case, I think we are fairly safe assuming that if they bothered to enter the trailing zero, they mean it, so we'll go with 3.
- A lab value of 120 might have 2 significant figures or 3 as well. This one is somewhat murkier than the above case, in my opinion, because we really don't know how approximate that result is; perhaps it is really closer to 119 but the equipment isn't precise enough to measure it. Again, since we have no way to know, we'll assume that this number has 3 significant figures.
With those assumptions, I can figure out how many significant figures the user entered in JavaScript (well, CoffeeScript, really) like this:
numberAsString = @find('.value').val()
sigFigs = numberAsString.replace(/[^0-9]/g, '').replace(/^0+/, '').length
Well, not very pretty, but it should get the job done. Because of our two assumptions above, we can just treat all trailing zeros as significant, and then we just have to count all the digits except leading zeros. We'll then pass this along to the server, along with the value the user entered, and save it as part of the row in lab_results.
Displaying things: the nightmare continues
So then all we have to do is use that information at display time to round the number to the right precision, right?
%strong #{number_with_precision value, delimiter: ",", precision: sigfigs || 0, significant: true}
Indeed, it really is that easy in Rails, because of the awesome ActionView::Helpers::NumberHelper#number_with_precision method. And JavaScript has a similar method. Seems like all we have to do for the charts will be to pass along the significant figures to JS as well, and use that method to format numbers. Right?
Of course not. Things are never that easy with computers.
The problem is that Number.prototype.toPrecision and number_with_precision are using different tie-breaking methods for rounding. Let's say you have a value of 0.6425 in the database, and it has 3 significant figures. (How can this happen, you ask? It might be the result of unit conversion; you entered a different number with 3 significant figures in a non-default unit, and we converted it to the default unit and got this result.)
Anyway, you have 0.6425 with 3 sigfigs in the database. How should we display it?
- The Rails helper uses the "round half up" tie-breaking method, which is what I was taught in grade-school math, and rounds it to 0.643.
- The JavaScript method uses the "round half to even" tie-breaking method, aka "bankers' rounding" or "unbiased rounding". (This is also what the IEEE 754 standard for floating-point numbers specifies should be used.) In this method, we break a tie by rounding to the nearest even number. In this case, the result would be 0.642, since 2 is even.
Having a discrepancy between the charts and the HTML we render would be bad enough, but in this case, it would be a really noticeable error too, since the charts typically appear on the same page as the data table, so the two representations of data would disagree with each other on the same page!
So, what should we do about this? There's no clear-cut answer, but we ended up going with Rails' implementation of it, because round half up is likely to be more familiar to most users without a stats or finance background. To get this behavior in JavaScript, we added a library called big.js, which bills itself as "a small, fast JavaScript library for arbitrary-precision decimal arithmetic." It seems like a pretty nice library that we could use in other places on the site as well, and it does this job admirably:
var valueString = new Big(value).toPrecision(sigfigs);
Big.js happens to round half up by default, but if we wanted a different rounding method, we could do something like this:
Big.RM = 2; // 2 is big.js's rounding mode constant for ROUND_HALF_EVEN
You got math in my computer programming
Sometimes a seemingly-simple feature like this one leads you down a very deep rabbit hole of math and computer science. Most of the time, programming is not math, and my job doesn't require me to think back to my high school math and science classes, but this week was not one of those times. In fact, this is probably one of those exceptions that proves the rule: even when working on an app dealing with medical data, the problems I solve on a daily basis have a lot more to do with user interaction, web browsers, and data modeling than they do with math.
Next time on "things programmers don't think are as complicated as they actually are," we'll talk about dates and times. Or people's names. Or really, anything about people.